Across the United States, cities may be carrying more than $1 trillion in infrastructure liabilities that are largely invisible to the municipal market. These liabilities are the accumulated costs of aging roads, bridges, public buildings, and other infrastructure. In many cases, they are not reflected in the credit metrics used by rating agencies and investors.
The $1 trillion price tag is one conclusion of an analysis by municipal finance researcher Richard Ciccarone, a prominent municipal market expert and President Emeritus of Merritt Research Services. Unlike debt service or pension contributions, deferred infrastructure maintenance generally carries no legal funding requirement. Governments can postpone investment, allowing infrastructure liabilities to accumulate without triggering consequences for their credit ratings. The result is a significant blind spot in how municipal financial risk is measured.
That blind spot is amplified by climate risk. Aging assets are being exposed to extreme weather (like this year’s super El Niño) and more frequent disasters that can accelerate deterioration, increase repair costs, and make assumptions about useful life far more uncertain.
Cities and communities across the U.S. need better ways to identify infrastructure liabilities, understand how physical risk could amplify them, and incorporate resilience into capital planning and long-term financial management.
City Balance Sheets Leave Out $1 Trillion in Invisible Liabilities
To measure the wear and tear on municipal balance sheets, Ciccarone quantified the cost of replacing and maintaining municipal infrastructure and capital assets that have already been consumed but remain in service. The analysis focused on roads, bridges, buildings, equipment, and public safety assets, while excluding enterprise operations such as water, sewer, and electric utilities.
Ciccarone analyzed the audited financial statements of nearly 2,000 U.S. cities, using government-reported capital asset data and useful-life schedules. Then, he estimated the inflation-adjusted costs necessary to update roads, bridges, buildings, public safety equipment, and other governmental capital assets supported by tax revenues. He called this metric the “Infrastructure Capital Asset burden” (ICA), he explained in an interview with the Epicenter.
He shared two takeaways:
Cities carry a much larger infrastructure replacement burden than standard balance-sheet views suggest. The wear and tear on city infrastructure is not treated as a liability even though it represents a long-term obligation to keep municipal infrastructure usable. “As long as you’re going to maintain a government in which you have to have working roads and street lights and sidewalks and the list goes on, then they are a commitment that you must make. You must keep them up in a safe and usable condition,” Ciccarone said.
The capital asset burden is especially severe in older or shrinking communities. This is where infrastructure was often built for a larger population, economic base, and tax base than exists today, leaving fewer, often older taxpayers to support the same physical footprint. “Cities with stronger economic growth, newer housing stock, higher incomes, and better-funded pensions tend to maintain infrastructure more effectively. Conversely, cities with stagnant or declining populations and weaker fiscal metrics are far more likely to defer capital maintenance, compounding long-term costs,” the analysis said.
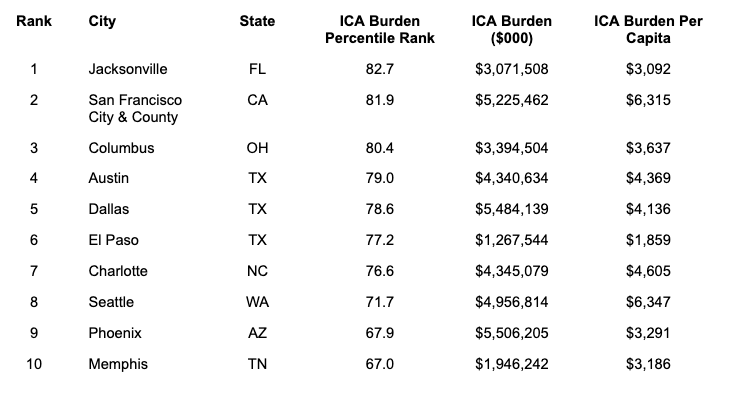
Best-Positioned Cities with Population of 500,000 or More
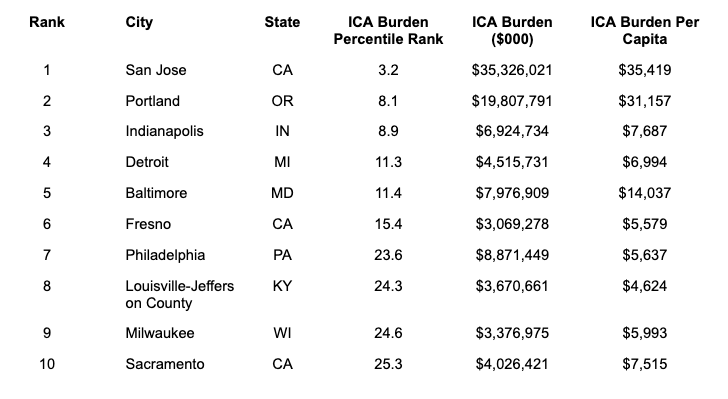
The following two charts rank cities by the ICA Burden Percentile Rank. That ranking compares cities based on several factors: the estimated cost of replenishing aging infrastructure and capital assets, accounting for each city’s size, resources, capital spending, and asset age. Higher percentiles indicate a more favorable position relative to other cities in the study. Check out the report for more explanation on how this ranking is calculated.
Worst-Positioned Cities with Population of 500,000 or More
Climate Disasters Can Drive a Cycle of Reinvestment
Because rating agencies don't penalize deferred repairs, cities trying to close budget gaps or avoid tax increases often delay maintenance. As extreme weather events grow in frequency and severity, cities may be deferring maintenance on the assets that get hit the hardest, and whose useful life is shrinking due to climate stresses. But the reverse can also happen: In the aftermath of a disaster, like a hurricane or a flood, some cities are taking the opportunity to repair and upgrade their physical infrastructure.
According to Ciccarone, one of the factors that makes Jacksonville the best-positioned large city in America, with the lowest Infrastructure Capital Asset burden, is its infrastructure investments after recent hurricanes. Hurricanes Matthew (2016) and Irma (2017) damaged Jacksonville’s infrastructure. In response, the city restored damaged assets and made necessary repairs and improvements to its municipal infrastructure. The storms played a role in accelerating a broader cycle of asset repair, renewal, and resilience investment. That cycle has continued, with a $1.2 billion five-year capital improvement plan to invest in city infrastructure, specific funding to storm-harden its port and docks, and investments in green infrastructure.
A New Tool Lets Cities Price Their Reserve Funds Against Actual Risk
Ciccarone’s research uncovers the financial burden cities might incur for their deferred maintenance, which helps city officials understand a crucial question in an era of increasing climate risks: How much should a city actually hold in reserve to cover it?
Using catastrophe models, insurers have priced their risk exposure for years, translating physical risk into dollar reserves. Local governments largely haven’t had access to the same tools. But that's beginning to change. The Government Finance Officers Association (GFOA), the national group of government finance professionals, has spent over a decade developing RiskReserve to close that gap. This year, GFOA partnered with The Resiliency Company to bring a new tool to a pilot cohort of local governments.
The RiskReserves Tool applies evidence-based risk modeling to help governments size their reserve funds against actual financial exposure: natural disasters and climate hazards, recession scenarios, tax base impairment, infrastructure disruption, and uncertainty tied to FEMA Public Assistance, the federal disaster-recovery reimbursement program local governments rely on after a major storm. Several of these, especially disasters and infrastructure disruption, are the same pressures that drive up a city's ICA burden. Jacksonville, whose post-hurricane infrastructure investment helped it post the nation’s lowest infrastructure capital asset burden, is an early example of what that discipline can look like in practice.
RiskReserve's pilot cohort launched this summer, with a national platform targeted for the fourth quarter of 2026.