We need to move beyond asking simply, How do we fund this project? and start asking, What financial risk does this community face, what outcomes could change that trajectory, and how should we invest accordingly?
When benefits tied to investing in resilience can be measured and demonstrated, major new sources of capital become available to help finance resilience.
By rebuilding the same way we’ve done in the past, we’re ensuring the trend will continue: a costly and frequent cycle of destruction and reconstruction that can threaten existing assets and multiply financial losses across every sector.
In the 1980s, the United States went an average of four months between billion-dollar disasters. In 2024, we experienced one every other week. Across the U.S., 91% of districts include a county that has received a federal disaster declaration for an extreme weather event between 2011 and 2023.
What’s Going On?
Why are billion-dollar disasters suddenly everywhere? Are the most expensive disasters, like Hurricane Katrina, becoming more frequent? Or are the most frequent disasters, like a 30-minute hail storm, becoming more expensive?
The story, as our research reveals, is more complex and nuanced: there are a small handful of factors that have conspired to create a perfect storm of expensive, frequent disasters—whether they’re severe weather in Texas, wildfires in California, or flooding in the northeast. The time is shrinking between disasters hitting. The costs are rising. The need to protect assets and reinforce critical infrastructure is only becoming more urgent.
What Makes a Disaster?
Acute climate-driven disasters are sudden, one-off climate events, like earthquakes, floods, fires, and storms. The National Oceanic and Atmospheric Administration (NOAA) catalogs disasters that cause over a billion dollars in damage, while the U.S. Federal Emergency Management Agency (FEMA) designates major disasters based on reaching a magnitude that warrants major disaster assistance.
These climate catastrophes are not disconnected from chronic, slower-moving climate stressors or hazards, like rising sea levels, longer droughts, and extreme heat. Heat waves, for example, haven’t historically been categorized as a disaster, but that could change.
What’s At Stake?
By rebuilding the same way we’ve done in the past, we’re ensuring the trend will continue: a costly and frequent cycle of destruction and reconstruction that can threaten existing assets and multiply financial losses across every sector.
For investors, understanding the landscape of costly disasters will help limit risk and generate insights about new opportunities.
For corporate leaders looking to avoid disruptions in supply chains and protect physical assets, assessing these fast-changing dynamics is a business imperative.
For insurance companies looking to avoid losses and provide coverage, the era of climate disasters presents existential risk and new opportunities to their businesses.
For policymakers and community leaders, understanding the economics of disasters can unlock the right resources at the right time and ensure resources flow where they are needed most, without exacerbating the racial wealth gap that climate change already threatens to widen.
But before we can build a map of the opportunity space and provide actionable recommendations, we first need to understand why disasters are so expensive. That’s where we’re starting today.
How Costs Are Measured
NOAA calculates disaster costs by using over a dozen public and private data sources to assess direct damage to buildings, vehicles, roads, energy infrastructure, and agriculture, along with wildfire suppression and business interruption costs.
The "billion dollar" threshold offers a consistent way to measure disaster severity, though NOAA's estimates don’t capture many social and cultural losses. These unaccounted factors include environmental degradation, loss of human life, mental health impacts, disruptions to livelihoods and social systems, forced migration, and widening racial wealth gaps.
While NOAA’s $1B cost framework is useful, it acknowledges that disaster impacts extend far beyond financial estimates.
The Rise In Billion-Dollar Disasters
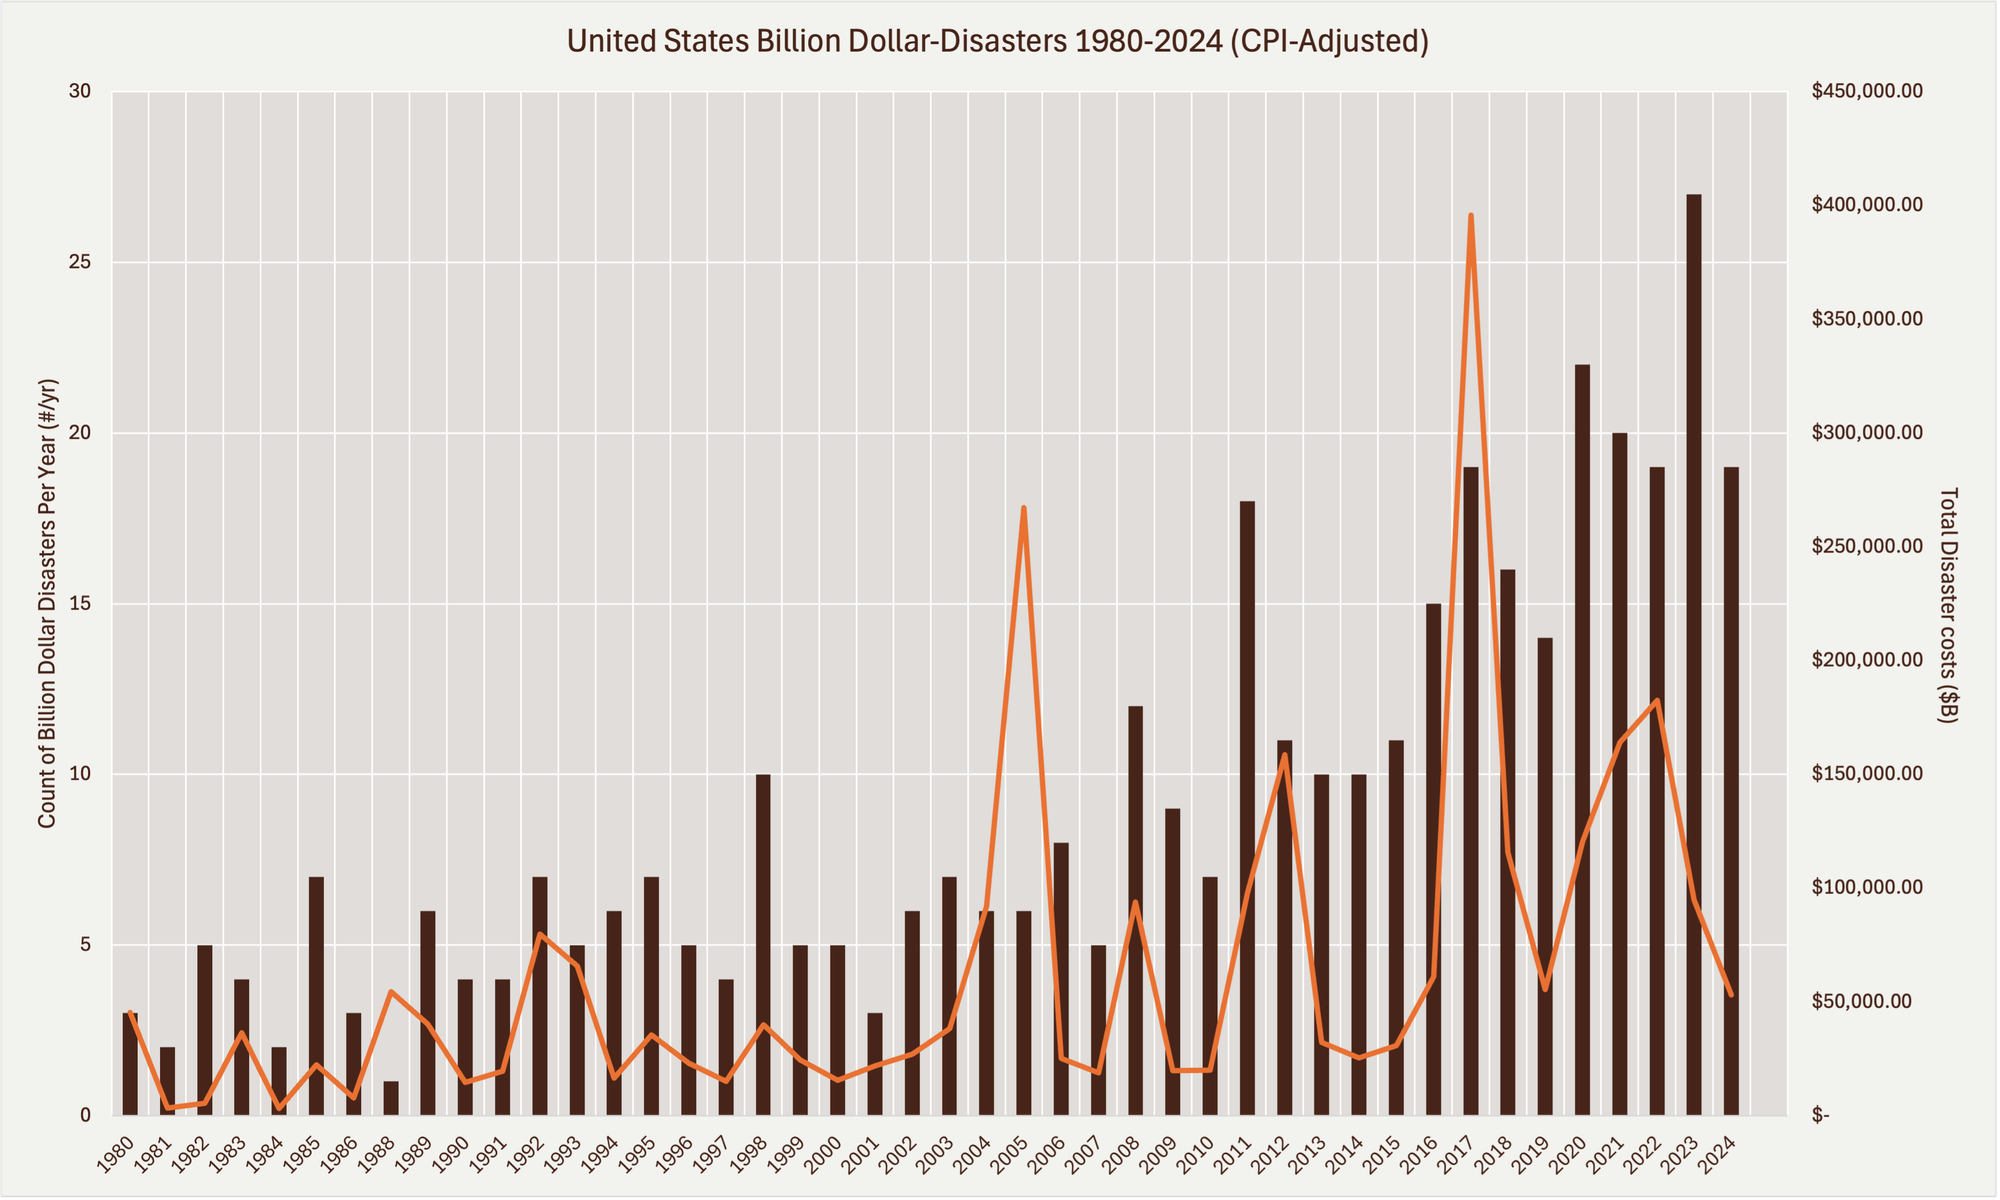
Since 1980, there have been 395 weather and climate disasters in the U.S. that have each exceeded $1 billion in costs (CPI adjusted). The cumulative cost for these 395 events is over $2.7 trillion. For context, if you divided that amount by the 333 million people living in the U.S. in 2024, you could give each person over $8,000.
Figure 1: Billion-Dollar Disasters by Magnitude of Count and Costs per Year (1980-2024). While 2024 is still in progress, the general trend indicates that billion-dollar disasters are growing in frequency and severity. Adapted from NOAA NCEI, 2024.
And of these 395 events, 327 of them have taken place since 2010, which means 82% of the billion-dollar disasters over the last 45 years have taken place in just the last 15 years.
The Drivers of $1 Billion Disasters
Our research points to four main drivers contributing to the growth in billion-dollar disasters.
1. Higher frequency and greater severity are increasing the cost of disasters
The U.S.’s Fifth National Climate Assessment, released in 2023, found that climate change increases the frequency of weather extremes that lead to billion-dollar disasters. Extreme weather begets extreme weather, as Mathew Sanders of Pew Research explained, “Extreme heat can exacerbate drought conditions, increasing wildfire risk. Wildfires leave behind barren landscapes, where vegetation would otherwise reduce runoff, increasing flood risk and leaving hillsides vulnerable to mudslides.”
2. Greater asset exposure drives costs up
There are more assets at risk today than there were in the 1980s. NOAA credits both the increase in population and the increase in asset prices as key drivers of rising costs. Population growth, population migration, and unsustainable and discriminatory land use and development have pushed communities into harm's way. Today, 39% of all the houses in the U.S. are in the wildland-urban interface. The #1 and #2 fastest growing states in the U.S. from 2022 to 2023—Texas and Florida—are also the states with some of the greatest climate risk and highest frequency of disasters each year.
3. More vulnerable assets translates into more expensive disasters
Greater vulnerability of an asset, as measured by the extent of damage caused by a given hazard, also drives up insured and uninsured costs. Without up-to-date building codes and new disaster resilient construction materials and technologies, assets remain vulnerable to greater damage. Severe storms can quickly turn into disasters costing billions of dollars. Meanwhile, as insurance premiums spike, more homeowners are going without insurance (more than 1 in 10 U.S. homes is uninsured), further exacerbating the vulnerability of what is often their most valuable asset: their home.
4. Premiums to rebuild drive up reconstruction costs
In the wake of a disaster, there is a rebuilding premium as a surge in demand outpaces supply, leading to soaring costs. According to a 2023 report by Harvard University’s Joint Center for Housing Studies, every year across the U.S., $20 billion is spent to repair homes—just homes—following both minor storms and major disasters. This is a $3 billion annual increase from 2021 (just two years prior to the report), and nearly double the $12 billion spent annually in the decade between 2000 and 2010.
While these drivers increase overall disaster expenses, there are resiliency levers to reduce costs and build more resilient infrastructure.
Investing In Resiliency
The U.S. Chamber of Commerce found that every $1 invested in disaster preparation can save $13 in economic costs, damages, and cleanup.
But not all disasters are created equal: resilient approaches to reduce the damages from a wildfire are different from those for a flood or severe storm. Plus there are regional differences and discrepancies in local policies and funding.
Investments in resiliency and preparedness won’t completely eliminate losses or stop the storms from coming, but they can significantly reduce the damages that communities face.
What do solutions look like?
Reform building codes and zoning for development, to require new buildings to meet updated construction standards. This has proven to have a benefit cost ratio of 11:1–meaning every $1 spent to build to updated code saves $11.
Early warning systems can save lives and assets worth at least ten times their cost. Just 24 hours of warning for a storm or heat wave can cut the ensuing damage by 30%.
For private and public investors and decision-makers, the lens of resiliency can generate powerful financial returns, while fortifying the critical infrastructure our communities rely on.
What’s Ahead
For the next few months, we will conduct a series of deep-dives for specific types of disasters; starting with wildfires, then flooding. For each, we’ll explore the drivers leading to increased cost and other impacts, the levers to reduce the damage, and how capital allocators and decision-makers can make these insights actionable.
In our next edition, we’ll profile the state of wildfires in the U.S. and how resiliency can make them less destructive.
Have thoughts to share on this piece, or want to add your voice to the conversation? Reach out!
Sign Up For The Epicenter
The Epicenter is a regular briefing that helps decision-makers understand the risks and impacts from climate hazards and discover practical, cost-effective resilience solutions.
The lack of standard home rebuilding playbooks, combined with the uneven delivery of federal disaster recovery funding, has led to fragmented rebuilding efforts over the past few decades. However, disaster recovery has evolved to more systematic approaches using pre-approved home plan catalogs.
Twenty-three billion-dollar disasters, $115 billion in damage, and not one hurricane: 2025 was a masterclass in how climate risk in the U.S. has changed.
Twenty-three billion-dollar weather and climate disasters struck the United States in 2025, revealing important takeaways for decision-makers in the real estate, public infrastructure, and insurance sectors.